Slow Query Log Analyzer (QLA)
Aggregate slow-query workload from digest tables, slow logs, or uploaded files — rank fingerprints by impact, batch-analyze with Optimize All, apply index DDL with optional before/after validation, and jump into the single-query Query Optimizer.
Overview
The Slow Query Log Analyzer (MySQL/MariaDB) and Query Log Optimizer (PostgreSQL) share one panel. They:
- Load workload from performance digest (
events_statements_summary_by_digest/pg_stat_statements), server slow-log tables, auto-detected log files, or drag-and-drop uploads. - Normalize statements (literals → placeholders) into fingerprints and score them by response time, call count, rows examined, and usage share.
- Prioritize with impact rank, bubble timeline, and usage breakdowns by table, database, and user.
- Tune in bulk — Optimize All Queries fills index recommendations; Create Indexes + Validate applies DDL and compares EXPLAIN before/after.
- Drill down — per-row EXPLAIN, single-query Optimize, copy SQL, or export index scripts.
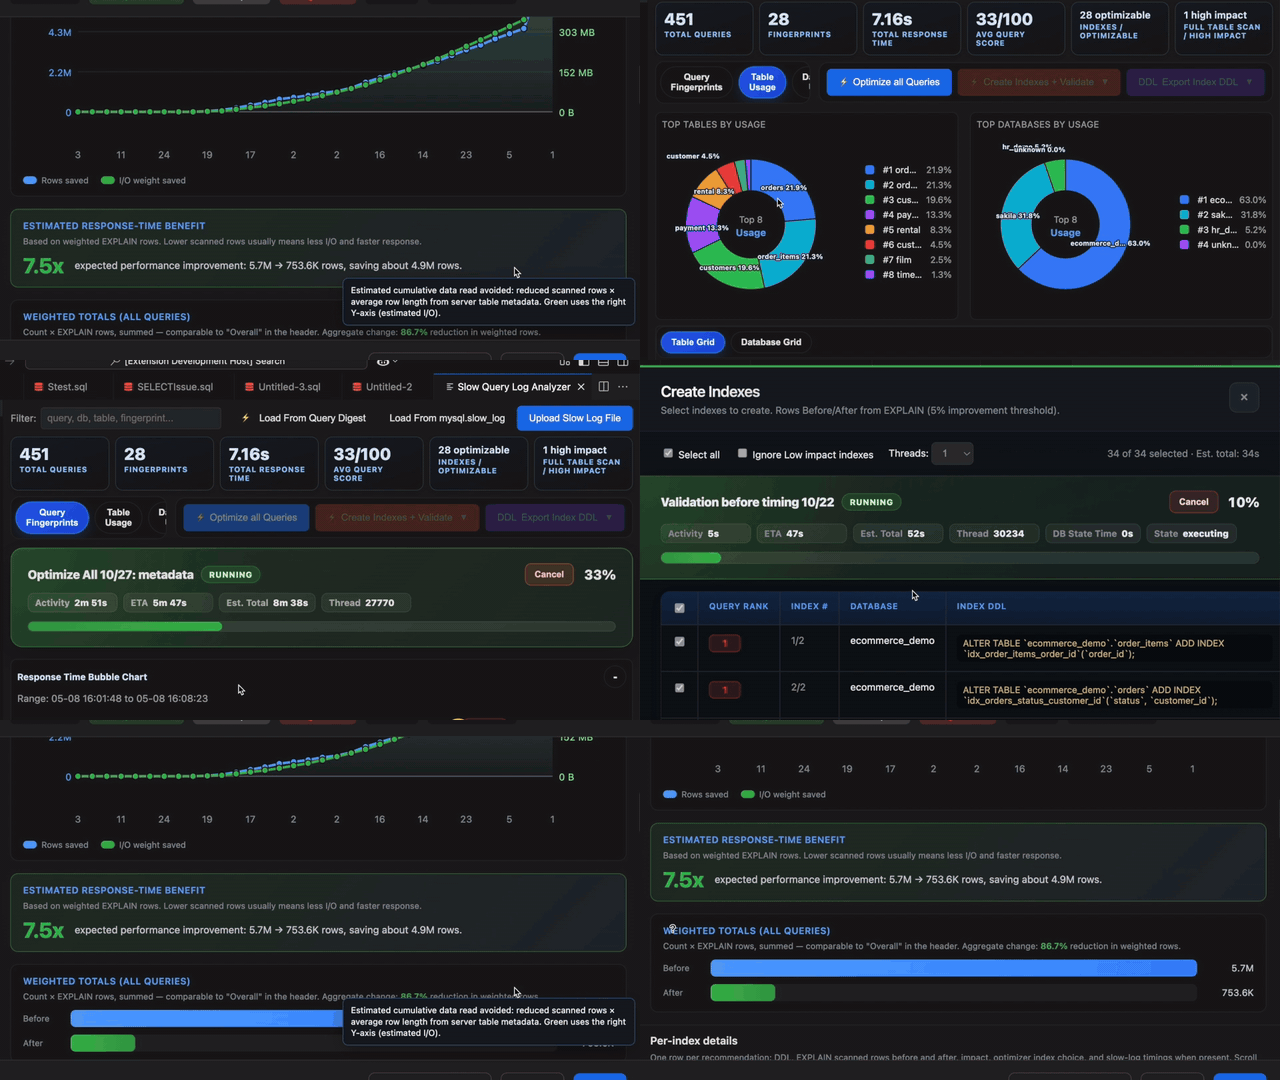
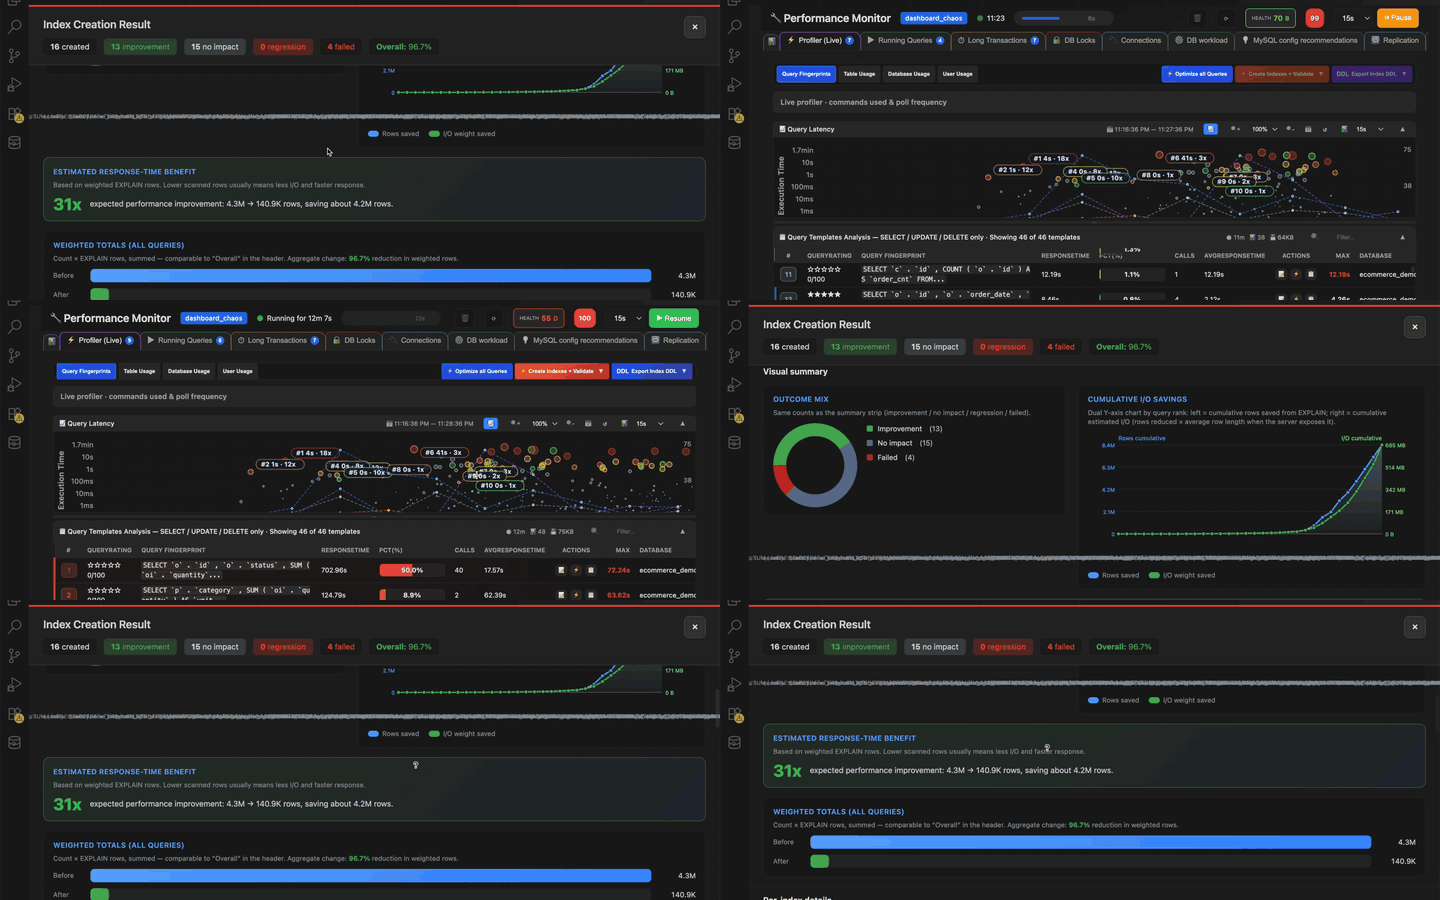
MySQL/MariaDB connections show Slow Query Log Analyzer. PostgreSQL connections show Query Log Optimizer — same panel, engine-specific data sources.
How to open
- Database tree — right-click a connection or database → ⚡ Query Log Optimizer (PostgreSQL) or the connection’s slow-query command (MySQL/MariaDB).
- Command Palette — search for slow query / query log optimizer commands tied to your active connection.
- Performance Monitor — open the Query Log Optimizer from the debugger workbench when monitoring a session.
The panel opens scoped to the tree node you picked. Confirm the sidebar Active database matches the workload you intend to tune.
Home screen — choose a data source
Before any grid appears, the home screen offers one or more load paths. Filters on each card control time window, row limit, and sort order.
MySQL / MariaDB sources
| Card / control | What it does |
|---|---|
| Query Digest → Analyze Query Digest | Reads performance_schema.events_statements_summary_by_digest. No slow log setup required. Filters: Last Seen Within, Latest Rows Limit, Sort by (total time, avg time, call count). |
| mysql.slow_log → Analyze mysql.slow_log | Reads the slow-log table when slow_query_log=ON and log_output=TABLE. Same time/limit/sort filters as the table card. Disabled until the server reports the table is available. |
| Upload File / drop zone | Parse a local slow log (.log, .txt, .csv). Drag-and-drop or click to browse. |
| Enable Slow Query Log | Appears when auto-detect finds logging off. Opens a modal with SQL to enable logging (requires elevated privileges). |
| Load from MySQL Slow Query Log | After auto-detect finds the server log path: loads the file directly (or last N lines when the file exceeds 100 MB). |
| Read last … lines | Tail input (default 10,000 lines) for very large on-server log files. |
PostgreSQL sources
| Card / control | What it does |
|---|---|
| pg_stat_statements → Analyze pg_stat_statements | Recommended. Cluster-wide stats since last reset. Requires extension + shared_preload_libraries. Badge shows Ready or Not installed. |
| Connect through | Database where CREATE EXTENSION pg_stat_statements was run (extension catalog location). |
| Load workload from | Limit initial load to one database, or All databases for cluster-wide view. |
| Min Avg Time (ms) | Filter out fast statements (0 = include all). |
| Latest Rows Limit / Sort by | Cap rows returned; sort by total time, avg time, or call count. |
| Upload PG Log File / drop zone | Parse server log output from log_min_duration_statement. Auto-detect for local servers when logging collector is on. |
| Enable PG Slow Logging | Guidance when statement logging is not configured. |
Toolbar after load
Once a report is loaded, the top toolbar switches from load buttons to filtering plus reload shortcuts:
| Control | MySQL / MariaDB | PostgreSQL |
|---|---|---|
| Load From Query Digest | Reload from performance_schema digest | Load From pg_stat_statements |
| Load From mysql.slow_log | Reload from slow-log table | — |
| Upload … | Upload Slow Log File | Upload PG Server Log |
| Filter | Text filter across query text, database, table, fingerprint | |
| Tune DB (PostgreSQL only) | Dropdown to scope grid, Optimize All, and Create Indexes to one database | |
Summary stat cards
Six tiles above the tabs summarize the loaded report:
| Card | Meaning |
|---|---|
| Total Queries | Raw execution count in the loaded window |
| Fingerprints | Distinct normalized query patterns |
| Total Response Time | Sum of execution time across the workload |
| Avg Query Score | Mean optimization score (0–100) across fingerprints |
| Indexes | Count of index recommendations after Optimize All (or placeholder before run) |
| Full Table Scan / Improvement | Full-scan query count and expected improvement summary after batch optimize |
Main tabs
| Tab | Contents |
|---|---|
| Query Fingerprints | Primary tuning grid — ranked statements, row actions, recommended indexes. Bubble timeline chart above the table. |
| Table Usage | Dual pie charts (top tables & databases by usage %) plus a sortable Table Grid / Database Grid sub-tab. |
| Database Usage | Same analytics as Table Usage with database-first breakdown. |
| User Usage | Bar charts and grid: calls, usage %, response time, rows examined per database user. |
Click any column header in a grid to sort ascending/descending. On Query Fingerprints, the # rank column is fixed by impact priority (not affected by sort order).
Query Fingerprints — columns
| Column | Description |
|---|---|
| # | Impact rank among visible rows (1 = highest impact). Color-coded badge. |
| Impact | Numeric impact score — higher means more pain in this workload. |
| QueryRating | Star rating (1–5) plus grade chip (A–E) and optimization score /100. |
| Query Fingerprint | Normalized template; hover for sample SQL with literals. |
| ResponseTime | Total time for this fingerprint in the window. |
| PCT(%) | Share of total workload time — heat bar visualization. |
| Calls | Execution count. |
| AvgResponseTime | Mean time per call with sparkline vs. peers. |
| Actions | Per-row EXPLAIN, Optimize, Copy (see below). |
| Max | Longest single execution. |
| Database / Table | Schemas and tables referenced. |
| QueryScore | Composite score: 40% response time + 25% usage + 25% rows examined + 10% rows-examined/sent ratio. |
| RowsExamined / RowsReturn | Average rows scanned vs. rows returned to client. |
| Type | Quality tag: OK, SLOW, BAD, or BAD+SLOW. |
| Recommended Indexes | Before Optimize All: prompt button. After: summary chip + copy DDL / copy rewrite tips. |
Row action buttons
| Button | Action |
|---|---|
| 📋 EXPLAIN | Opens Visual Explain / plan analysis for that fingerprint’s sample query in the Query Optimizer workbench. |
| ⚡ Optimize | Full optimizer analysis (indexes, rewrites, plan issues) for one statement. |
| 📋 Copy | Copies sample SQL to the clipboard. |
| 📋 Copy index DDL (Recommended Indexes) | Copies all CREATE INDEX statements for that row. |
| 📝 Copy rewrite tips | Copies textual rewrite guidance from recommendations. |
Rows that cannot be optimized (e.g. missing sample SQL, unsupported statement type) show — with a tooltip explaining why. Optimizable types: SELECT, UPDATE, DELETE, WITH.
Action bar (batch operations)
Right of the main tabs:
| Button | What it does |
|---|---|
| ⚡ Optimize all Queries | Runs the Query Optimizer across top fingerprints (scope set in Optimizer Settings). Fills Recommended Indexes column and updates summary tiles. Shows progress banner with cancel. |
| Create Indexes + Validate ▼ | Dropdown: Create Indexes + Validate (EXPLAIN before/after) or Create Indexes only. Opens full-screen Create Indexes overlay. |
| Export Index DDL ▼ | Export indexes script (save file) or Copy indexes script (clipboard). Requires Optimize All first. |
| 🔍 Settings | Opens Optimizer Settings modal (sampling + Optimize All scope). |
Bubble timeline (Query Fingerprints tab)
Above the fingerprint table, a scatter timeline plots slow executions over time:
- Bubble size reflects query duration; color matches impact rank (top 10 highlighted).
- Hover for timestamp, duration, fingerprint snippet, grade, and quality tag.
- Click a bubble to scroll and highlight the matching grid row.
- Toggle/zoom controls collapse or expand the chart when space is tight.
Operation progress banner
During Optimize All, Create Indexes, or validation, a status banner appears below the action bar:
- Status text and badge (Running, OK, Warning, Blocked).
- Progress bar with percentage and optional ETA chip.
- Cancel — stops the batch and kills the active server query when possible.
- Detail chips — thread id, DB state, elapsed time during long operations.
Create Indexes overlay
Full-screen flow opened from the action bar. Two phases: selection then results (after Create Indexes or Create Indexes + Validate).
Selection screen controls
| Control | Purpose |
|---|---|
| Select all checkbox | Toggle all index recommendations. |
| Ignore Low impact indexes | Deselects low-impact rows from the create list. |
| Threads | Parallel CREATE INDEX workers (1, 2, 4, 8, 16). Use 1 on busy production systems. |
| Summary strip | N selected · Est. total: … — selected count and rough duration estimate. |
| Per-row checkbox | Include/exclude individual CREATE INDEX statements. |
| Cancel | Close overlay without creating anything. |
| Create Indexes | Apply selected DDL without before/after EXPLAIN validation. |
| Create Indexes + Validate | Apply DDL, then run monitored before/after EXPLAIN and timing checks (5% improvement threshold for row counts). |
Results screen — visual summary
After validation completes, charts summarize aggregate benefit (as shown in the demo GIF):
| Section | What it shows |
|---|---|
| Outcome mix (donut) | Improvement vs. no impact vs. regression vs. failed recommendations. |
| Cumulative I/O savings (line chart) | Rows saved (blue, left Y-axis) and I/O weight saved (green, right Y-axis) — cumulative as each query is optimized. Hover points for per-query detail. |
| Estimated response-time benefit | Large Nx ratio from weighted EXPLAIN rows before ÷ after, plus absolute row savings (e.g. 5.7M → 753K rows). |
| Weighted totals (all queries) | Before/after bar comparison and % reduction in weighted rows (count × EXPLAIN rows, summed). |
| Per-index details grid | DDL, status, rows before/after, impact %, optimizer index usage, timings, errors. Scroll horizontally for all columns. |
Results screen — drop actions
| Button | Purpose |
|---|---|
| Drop unused indexes | Removes indexes from this batch that validation showed the optimizer did not use. |
| Drop all | Rolls back every index created from this recommendation set (confirmation modal). |
| Cancel (during drop) | Stops an in-progress drop operation. |
| Close | Exit results view back to the analyzer grid. |
Optimizer Settings modal
Gear icon in the action bar. Two tabs — settings persist in your VS Code profile.
| Tab / option | Description |
|---|---|
| Slow Query Optimizer → Collect query samples | When checked, fetches real literal values from history for better index recommendations. Uncheck to use normalized templates only. |
| Queries to optimize in "Optimize All" | All queries · Top 5 · Top 10 · Top 25 — limits batch analysis to highest-impact fingerprints. |
| Skip tables with many indexes | Coming soon — skip recommendations when a table already exceeds N indexes. |
| Query Optimizer → Collect query samples | Same sampling toggle for single-query Optimize opened from a grid row. |
| Save / Cancel | Persist or discard changes. |
Auto-detect & enable slow logging
QLA probes the server for log configuration:
- MySQL/MariaDB — reads
slow_query_log,slow_query_log_file, and whethermysql.slow_logis writable. Offers enable SQL when logging is off. - PostgreSQL — checks
logging_collector,log_min_duration_statement, andpg_stat_statementsavailability.
Enabling verbose statement logging adds overhead. Use conservative thresholds (long_query_time, log_min_duration_statement) and narrow time windows when loading digest stats.
Recommended tuning workflow
- Load the smallest window that captures the problem (digest is usually enough for MySQL;
pg_stat_statementsfor PostgreSQL). - Filter by database, table, or query text; on PostgreSQL use Tune DB to focus one schema.
- Review Query Fingerprints sorted by impact — inspect bubble chart spikes.
- Optimize All Queries (or top N via settings) to populate index recommendations.
- Export Index DDL for change review, or Create Indexes + Validate to measure EXPLAIN improvement on the server.
- For hard cases, use row ⚡ Optimize to open the full Query Optimizer (rewrites, visual explain, trace).
- Truncate or rotate logs after a tuning pass so the next analysis is not skewed by fixed queries.
Privileges & troubleshooting
- Integrated load needs
SHOW GLOBAL VARIABLES, digest-table SELECT, and schema privileges for EXPLAIN on your queries. - Upload path works offline — only file read access on your machine.
- If mysql.slow_log or digest buttons stay disabled, check the tooltip on the button or the home error banner for the server reason.
- PostgreSQL Not installed badge → run
CREATE EXTENSION pg_stat_statementsin the connect-through database and ensure the library is preloaded. - Empty Recommended Indexes after Optimize All → statement may not be optimizable, or no index would help (check row tooltip).
Tips
- Prefer Query Digest /
pg_stat_statementsfor ongoing triage — faster than parsing multi-gigabyte log files. - Use Top 5 or Top 10 Optimize All scope first on large workloads; widen after reviewing results.
- Group by fingerprint surfaces ORM/query-builder patterns that raw log lines hide.
- Pair batch index creation with the Query Optimizer Create Index flow when you need single-query rewrite guidance alongside DDL.
- Related: Performance Monitor for live server metrics; Query Profiler for session-level timing.